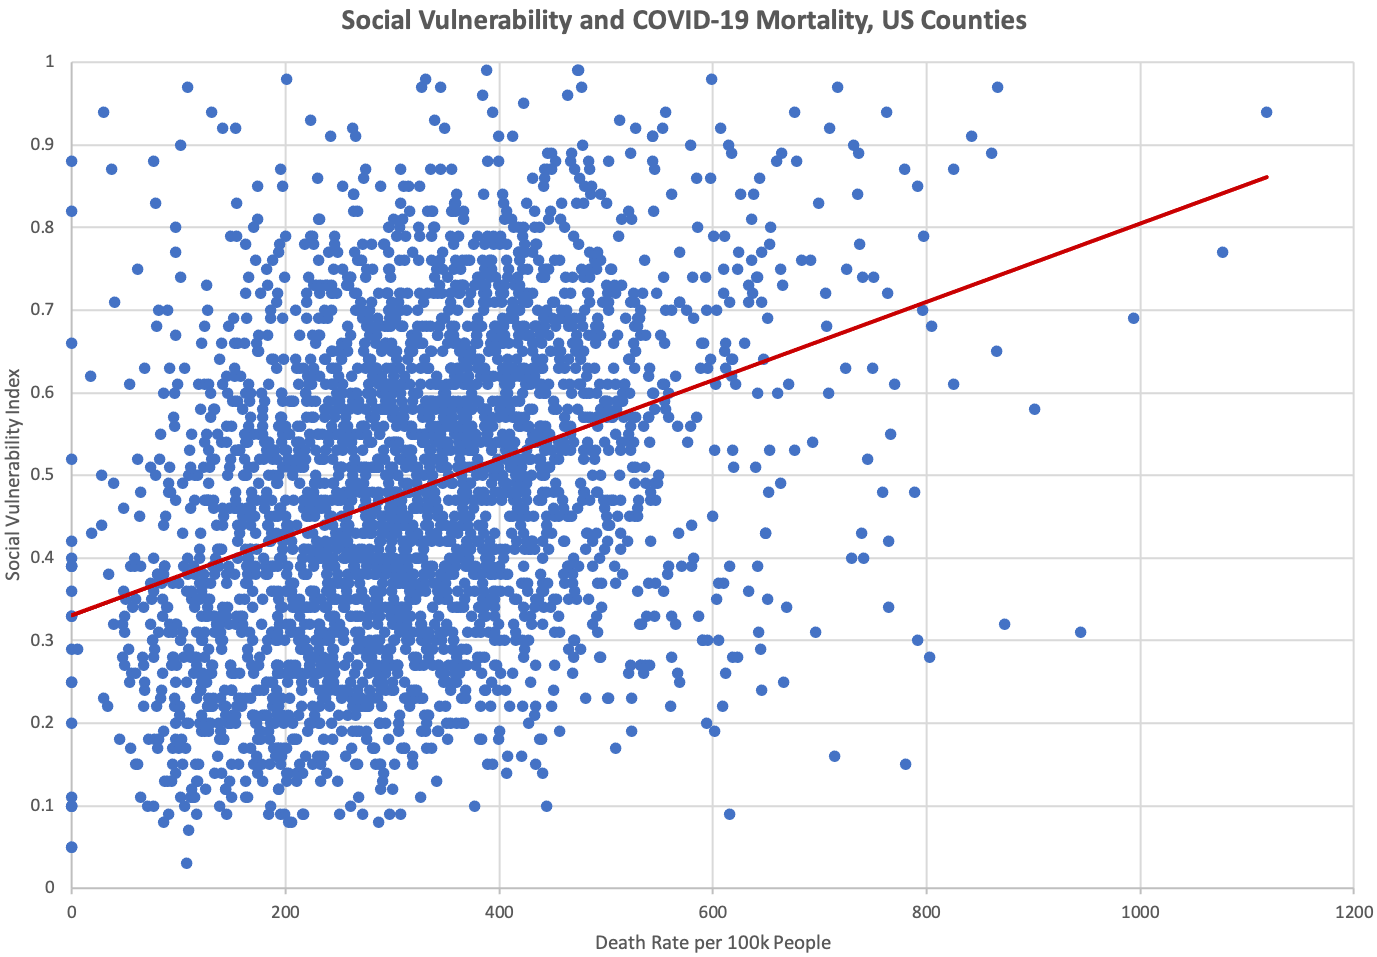
Interactive Map: COVID-19 Mortality and Social Vulnerability
Click to zoom to state. Mousewheel to zoom, drag and drop to pan. Use dropdown to select layer. Mouseover features to view data. See below for notes and sources.

Notes
- COVID-19 mortality rate and social vulnerability index have been segmented into three quantiles ("low", "medium", "high").
- COVID-19 death rate is per 100k people.
- American Indian Land Area Representations (yellow boundaries) have been filtered by select states and areas > 512000 acres2
Data
- Cumulative COVID-19 Deaths (New York Times, 01/21/22)
- COVID-19: Data (NYC.gov, 01/23/22)
- Social Vulnerability Index (CDC/ATSDR, 2018)
- Population Totals (United States Census, 2019 estimate)
- American Indian Land Area Representation (Bureau of Indian Affairs, United States Department of the Interior)
Resources